What "high water stress" means in VSME, and how to check your sites (B6)
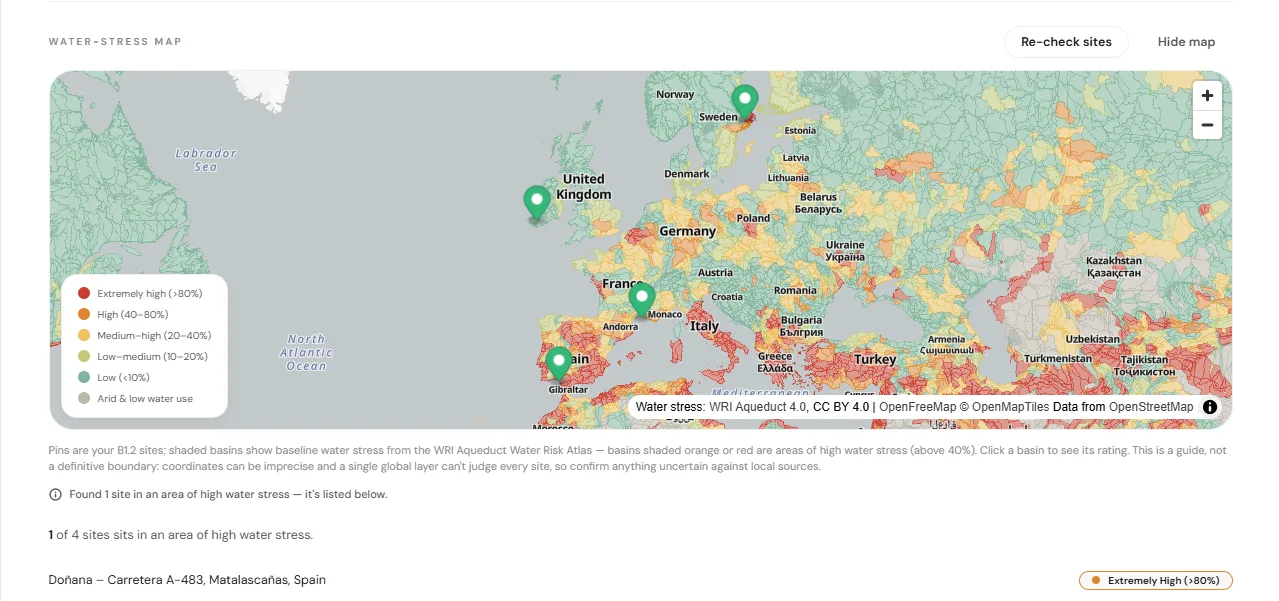
Disclosure B6 of the VSME standard wants exactly two numbers: the total water your company withdrew during the year, and how much of it was withdrawn at sites located in areas of high water stress.
The first number is on your water bills. The second one stumps everyone, because nobody knows offhand whether an address is “an area of high water stress”. It sounds like a judgement call.
It isn’t. There’s an official definition, a free map and a 40% threshold. Here’s how it works.
The definition: a ratio, not a vibe
Water stress is measured per river basin as baseline water stress: the ratio of total water demand (households, agriculture, industry) to the renewable surface and groundwater available there. It answers a blunt question: of the water that arrives in this basin each year, how much do humans already take?
Above 40%, the guidance says, an area counts as high water stress. The same paragraph names the tool the whole reporting world uses for this: the WRI Aqueduct Water Risk Atlas, which scores every sub-basin on Earth in bands:
| Band | Demand vs. supply |
|---|---|
| Low | under 10% |
| Low-medium | 10-20% |
| Medium-high | 20-40% |
| High | 40-80% |
| Extremely high | over 80% |
The bottom two bands, orange and red on the map, are what B6 means by high water stress.
It is not just deserts
The map holds surprises. Yes, much of Spain, southern Italy and Greece glows red; the guidance’s own worked example is the Iberian peninsula, where most of the south sits in high stress. But so do pockets far further north: heavily populated basins where demand is enormous even though rain is plentiful. Belgium, nobody’s mental image of a dry country, sits in the high-stress band of Aqueduct’s rankings, largely because Flanders packs so many people and so much industry onto so little river.
The reverse surprise also exists. The Sahara mostly isn’t classed as high stress. With almost nobody withdrawing water there, the demand-to-supply ratio is meaningless, and Aqueduct marks it “arid and low water use” instead, a separate category that the 40% test simply doesn’t apply to.
So don’t guess from the weather. Look it up.
Withdrawal is not consumption
While we’re defining things, the distinction that derails more B6 conversations than any other:
- Withdrawal is everything you draw into the organisation: mains water on the meter, plus your own wells, abstraction from rivers or lakes, and even collected rainwater if you’re a farm. If it came in, it was withdrawn.
- Consumption (B6.1) is the part that never goes back: evaporated in a cooling tower, transpired by irrigated crops, sealed inside your product.
An office withdraws water all year and consumes almost none of it; nearly every litre returns via the drain. The guidance is refreshingly blunt about this: for companies that take water from the mains and discharge to the sewer, consumption “will be close to zero and can therefore be omitted”. Consumption only becomes a real figure to report if you run genuinely water-consuming processes: drying, power generation, irrigation, making beverages.
Checking your sites
The manual route: open the Aqueduct atlas, search each site’s address, read the basin’s band. Free, and maybe fifteen minutes for a handful of sites. (For European sites the guidance also accepts the EEA’s WEI+ index, with the same 40% threshold.)
If your report lives in Verdnt, the sites you listed in B1.2 are checked automatically: they appear as pins over the Aqueduct water-stress layer, each one classified, and any site in a high-stress basin is flagged, so you know exactly which sites’ water bills feed the “withdrawn in high-stress areas” figure. In the screenshot above, the demo company’s site near Doñana in southern Spain comes back Extremely high (over 80%). No surprise to anyone who has followed Spanish water politics lately.
The fine print, stated plainly: coverage is near-global (basins tile the world, so nearly every site falls in exactly one), with a few data-poor regions showing as “no data”. Sites in “arid and low water use” basins are deliberately not auto-counted as high stress; the ratio doesn’t exist there, so the app surfaces them for you to judge with local knowledge instead of silently deciding either way. And as with any basin-level layer, it’s a guide: a single global dataset can’t rule on every borderline site, so confirm anything uncertain against local sources.
If a site is flagged
Practically, three steps:
- Pull that site’s water bills or meter readings for the year and report its withdrawal as the high-stress figure.
- Expect the follow-up question. A lender who sees withdrawals in a stressed basin will eventually ask what you’re doing about it. Even a modest answer (leak monitoring, rainwater for cleaning) belongs in your B2 practices.
- Re-check annually. Basins move between bands as demand grows and climate shifts; Aqueduct updates, and so should your answer.
Two numbers, one free map, one threshold. B6 is one of the quickest disclosures in the standard once you know where to look.
Verdnt is free and launching soon. Join the waitlist if you’d like the lookup done for you.
Related reading: Is your site in a biodiversity-sensitive area? · How to calculate your GHG emissions · Choosing the Basic or Comprehensive module